Revenue cohort retention: the sneakiest chart if you're not careful
The report I use the most for understanding growth opportunity
The report I've been using the most lately in my growth work: revenue cohort retention.
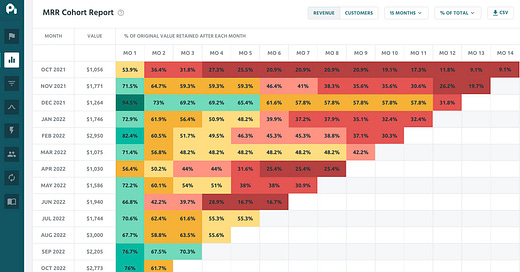
This is an example of what it looks like:
If you've got ProfitWell, Baremetrics, or ChartMogul, you 100% have this chart available to you for free.1
The gag? Most folks don't know how to use it or what it means.
Cohort retention tells you on average how many customers/revenue are retained month-over-month for each month from the same batch of customers/revenue.
So customers/revenue acquired in January of 2023 will have a retention percentage every month until now.
What does it tell us and how can we use it?
If overall growth performance of your business appears healthy (i.e. website conversion rates look good, activation rates look good, churn is within the 3% mark, MRR steadily growing, etc.) and it seems like there are no other opportunities, pull up this chart (and brace yourself lol).
If you've got an average revenue retention of less than 60% after 6 months,
it basically means you've got to replace about half of your MRR every 6 months (which you will absolutely "feel" — almost like you've been shipping a bunch of features or executing a bunch of marketing tasks and not knowing why it's not moving the needle).
It can also indicate that while churn might be "healthy", customers aren't sticking around long enough to balance out the acquisition cycle (which on average, takes about 6-12 months to gain customers from marketing activities).
This often looks like running yourself ragged on the acquisition side of the business while the product slowly churns out customers you worked super hard to acquire 6 or more months ago.
But it's sneaky because, again, churn looks "fine" and deceptively average.2
Then there's expansion revenue / monetization opportunities — usually businesses with low revenue cohort retention also don't have many opportunities for customers to expand their accounts as they achieve value and/or their monetization strategy needs a deeper look. Companies with strong expansion are usually making enough revenue to offset any lost revenue from churn (sometimes resulting in net negative churn).
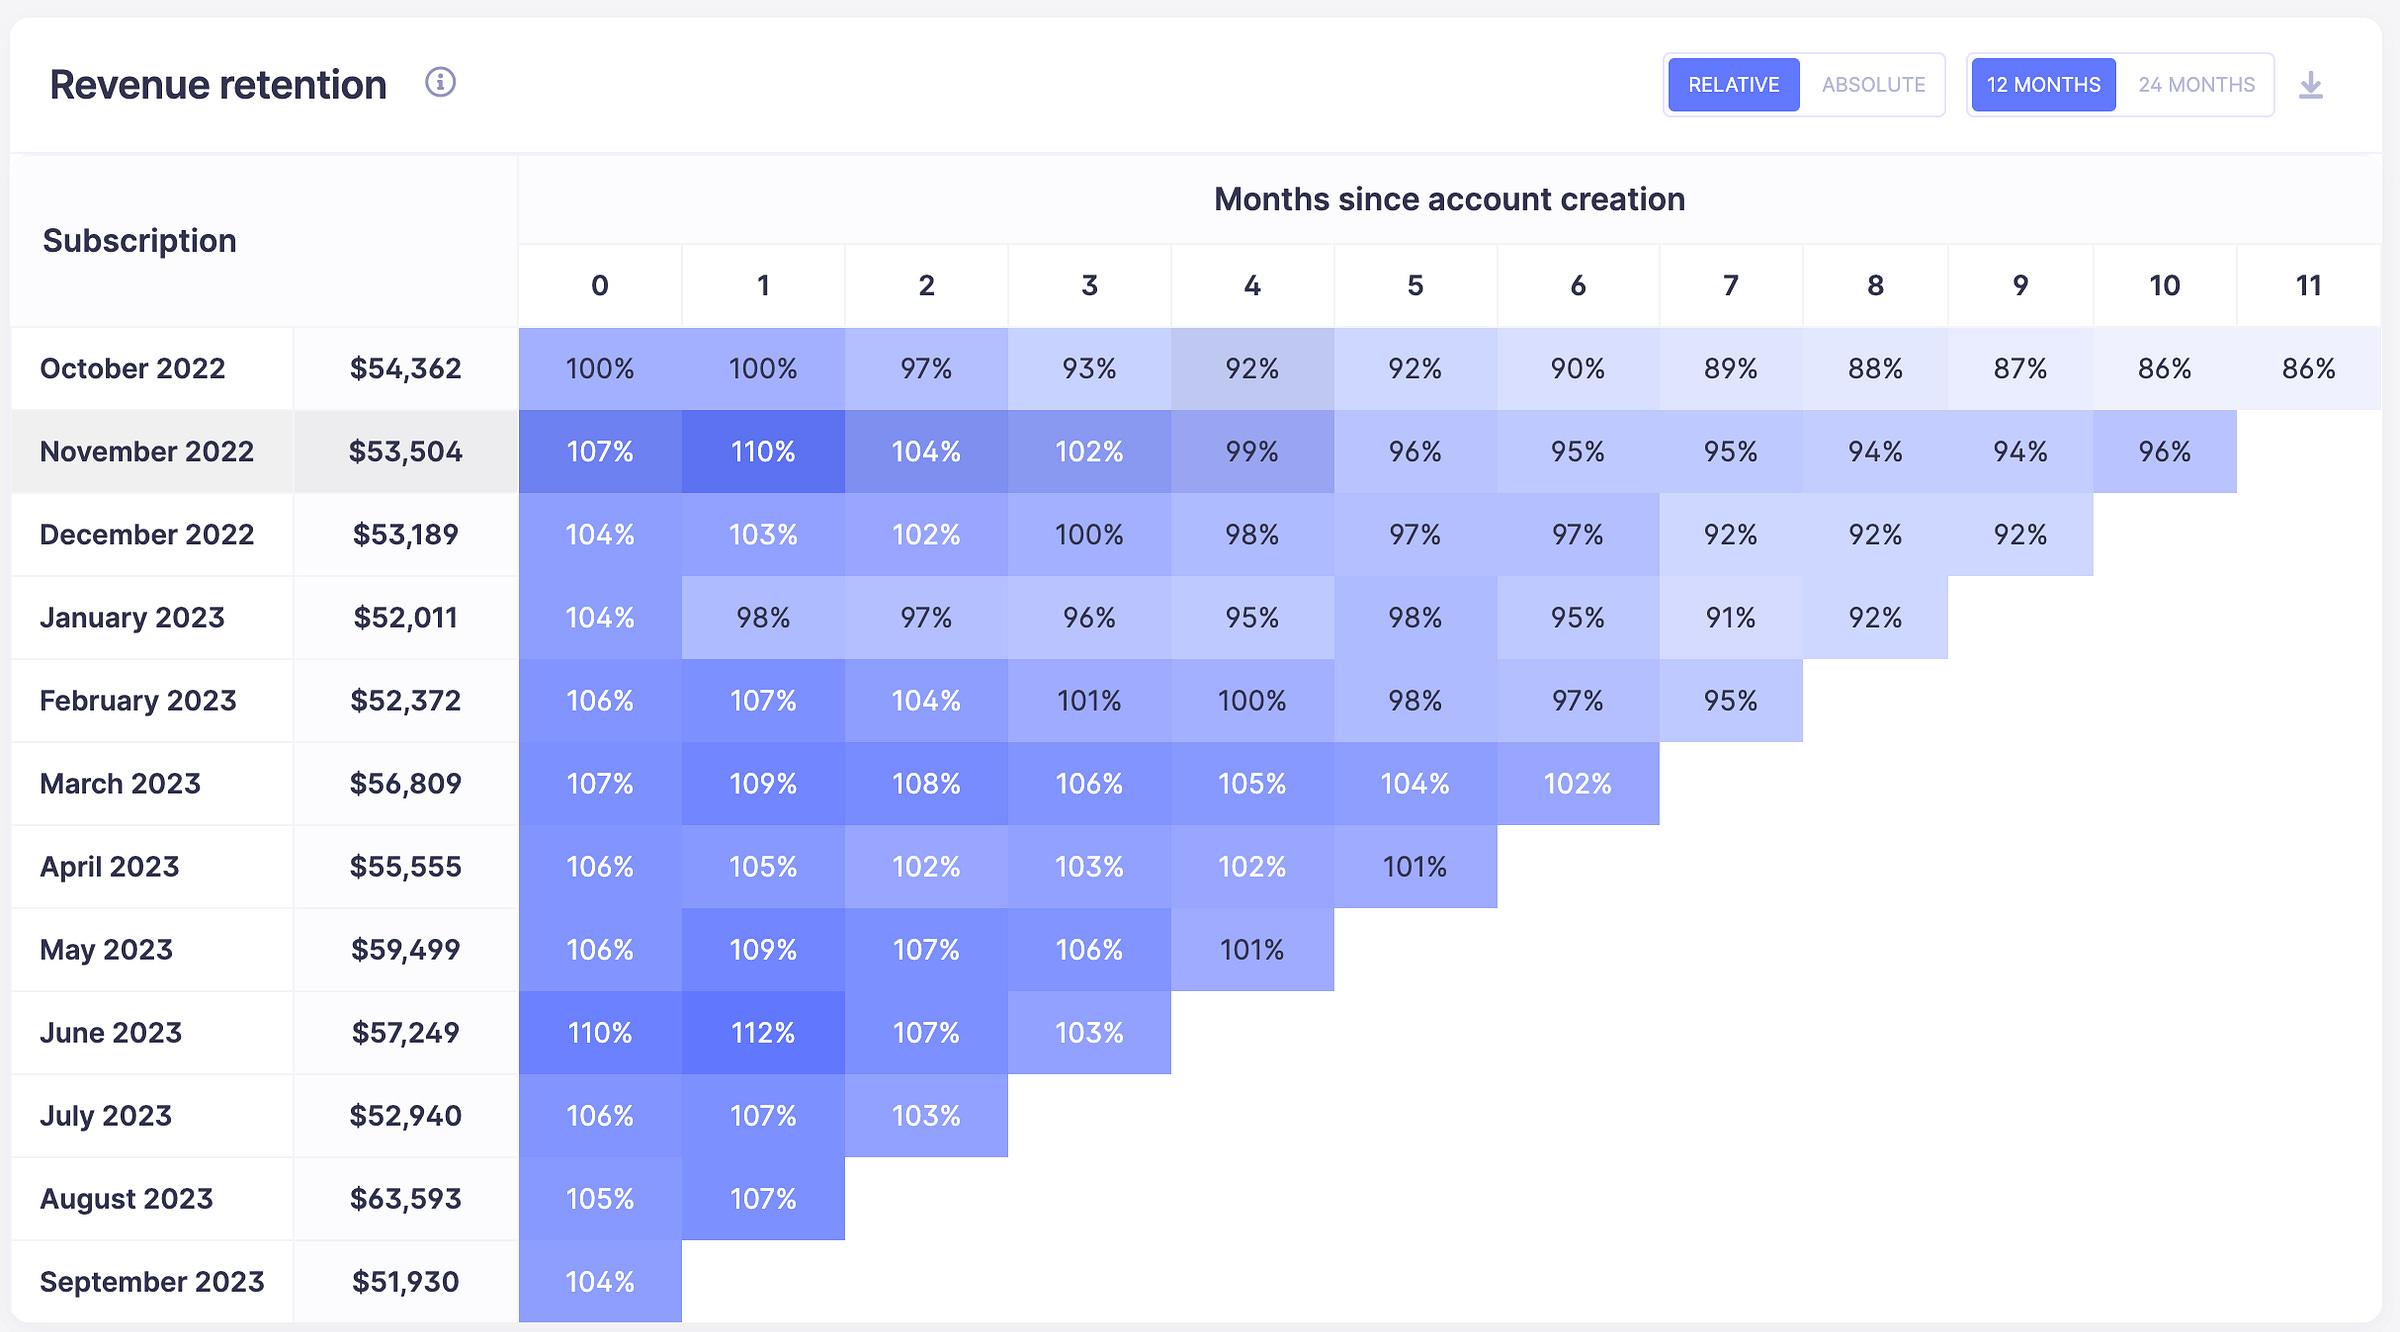
Best-in-class, high-growth orgs tend to have charts that look like the exact opposite of the one below. They typically have revenue cohort retention with 95%+ or higher after 12 months — which, let me tell you, creates what feels like life-changing business growth. I’ve got a couple of clients in this camp.
Here’s proof that revenue cohort retention like this actually exists from ConvertKit:3
If you're in the less-than-60%-after-6-months camp, it's time to stop and think strategically. Throwing growth tactics at the wall will waste your time because you're going to churn half or more of what you acquire after 6 months.
There’s a few drivers that impact this:
Product development
Both product discovery (the process of discovering value that the product can provide) and product delivery/management (actually building and delivering the thing) can be the root cause
This goes beyond “product-market fit” since the product does actually convert them, but it doesn’t retain them long-term which is a sign that new jobs are popping that the customer needs fulfilled after the initial one is satisfied
Qualified acquisition
Not attracting the right types of users
Ranges from messaging, segmentation, positioning, website experience, acquisition channels, and more
Customer experience
Customers not hitting the value moments they need in order to activate and stick around
Activation experience that isn’t as effective/convert as many new users or trialists
Ongoing customer engagement (see product development and product marketing)
Monetization
The pricing changed, but it didn’t match the expectations of customers you were already attracting, so they all mostly churned
Very common if you changed pricing and noticed things suddenly getting more difficult
Audit your growth and try to find the KPI that's slow or lagging. Re-visit your product strategy and determine if you're building features just to build them, or if you're actually contributing value that people will pay and stick around for.
If you're in the more-than-60%-after-6-months camp but not quite 95%, then you might be in a good place to look at monetization and pricing strategies (unless of course you recently changed your pricing and noticed a dramatic drop-off in revenue retention when you did).
All-in-all, the status of these reports will determine a lot of how growth will feel in your organization.
It’ll either feel like you’re guiding a giant boulder down a mountain or you’re pushing a boulder up a mountain and getting exhausted doing it.
If growth is feeling frustrating, see if your revenue cohort retention looks like the former picture.
If growth is feeling amazing but a little terrifying because you can’t keep up, see if it’s closer to ConvertKit’s.
Happy growing!
This isn’t a chart from an actual client so I can’t answer any questions about the company, but many B2B SaaS companies do have charts that look like this. I’ve seen it all.
Ideally less than 5% for SaaS companies doing "good” and less than 3% for companies doing “great”.
It’s interesting how 2023 so far looks really strong for them. Would be interesting to know what’s been helping improve retention!


